8 November 2026 · Soldr
Arduino Serial Monitor debugging: let the sketch tell you what's wrong
Short answer: a sketch that checks each part at startup and prints the result turns "it doesn't work" into a line you can act on. Sketches Soldr writes do this with tagged lines: [INIT] says whether each part answered, [TEST] shows a first reading, and [FIX] names the most likely cause when something fails. Open the Serial Monitor at 115200 baud and read them top to bottom.
Most first-time failures in a hardware build aren't code bugs. They're a swapped wire, a module at a different address, a sensor powered from the wrong pin. A blank screen or a still motor tells you none of that. The Serial Monitor can, if the sketch was written to report. This post shows what that reporting looks like in real sketches Soldr generated on 7 November 2026, and how to read it.
The legend line
Each of these sketches starts with a comment that explains the tags it will print:
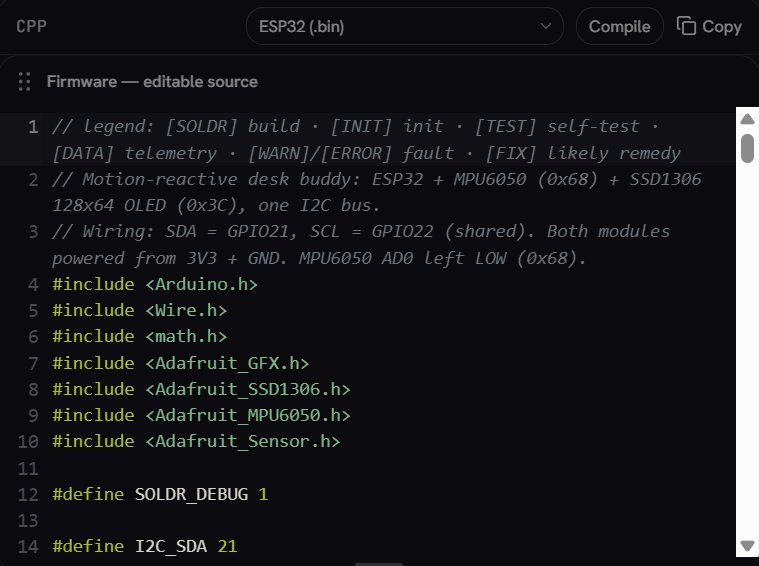
- [INIT]: did this part start?
OKorFAIL, with the reason. - [TEST]: one real reading straight after startup, so you can see the numbers are sane.
- [DATA]: the readings while the sketch runs.
- [WARN] / [ERROR]: something went wrong after startup.
- [FIX]: what to check first, in plain words.
Example 1: a sensor that doesn't answer
A desk toy with an ESP32, an MPU6050 motion sensor and a small OLED. When the screen or the sensor isn't found, the sketch says which one and why:
[INIT] SSD1306 OLED: FAIL (no ACK at 0x3C)
[FIX] SSD1306 OLED: check SDA=21/SCL=22 wiring, 3V3 power, and that the module address is 0x3C (not 0x3D)

[INIT] MPU6050: FAIL (no response at 0x68)
[FIX] MPU6050: check SDA/SCL wiring, 3V3 power, and that AD0 is low (0x68); eyes will idle-wander instead
"No ACK at 0x3C" means the board called that address and nobody replied. The fix line lists the three usual causes in order: the two bus wires, power, and the address. The last one is common with these OLEDs, because the same screen can be set to 0x3C or 0x3D. If the address is the problem, our post on I2C address conflicts shows how to check it with a scanner.
Note the end of the MPU6050 line: the sketch keeps running without the sensor (the eyes "idle-wander"). A sketch that carries on with one part missing is easier to debug than one that freezes at startup, because the rest of the build still proves itself.
When both parts are found, the next line is a first reading:
[INIT] MPU6050: OK
[TEST] MPU6050: ax=... ay=... az=... temp=...C
This sketch prints acceleration in m/s², so with the sensor lying flat one axis should read about 9.8 (that's gravity) and the other two near zero. If all three read zero, the sensor is answering but not measuring, which points to setup in code rather than wiring. The startup block ends with a one-line count of parts found and missing, in the form [READY] 2 OK / 0 FAIL.
Example 2: parts that can't report back
Some parts have no way to say they're connected. An LED doesn't answer, and a basic SPI screen accepts commands whether it's wired or not. A good self-test is honest about that. From a fireworks game with an ILI9341 screen and a TTP226 touch module:
[INIT] TFT ILI9341: OK (begin() cannot report presence)
[FIX] TFT: if screen is blank check LED->3V3, CS=5, DC=4, RST=13, SCK=18, MOSI=23
[TEST] TTP226 pads mask=0x00
[INIT] TTP226: OK
"OK (begin() cannot report presence)" is the sketch admitting that OK only means the code ran, not that the screen is there. So the fix line is printed anyway, as a list of every pin to check if you see a blank screen. The touch module is different: the sketch reads all eight pads at startup and prints them as a mask. If every pad reads as touched before you've touched anything, it prints:
[INIT] TTP226: FAIL (all pads read active)
[FIX] TTP226: check PAD_ACTIVE_LEVEL (module may be active LOW), VCC on 3V3, and do not touch pads at power-up
That one line covers the two real-world causes: a module set to the opposite output mode, and a hand resting on the pads when the board powered up.
Example 3: a visual self-test
For a row of LEDs, the only test is to look. A Diwali LED chaser on an ESP32 pulses each LED once at boot and logs it:
[INIT] LED1 (GPIO4): OK
...
[TEST] LED1: pulsed on GPIO4
...
[FIX] LEDs: if one did not light, check its polarity, its resistor and its jumper to the GPIO
Now a dark LED has a number and a pin. Compare the log with what you saw: if LED 3 never flashed, check the LED on GPIO14 first, starting with the long leg.
How to use this in practice
- Open the Serial Monitor before you power the board, at 115200 baud, so you catch the startup lines. In Soldr it sits in the Firmware tab, under the code.
- Read top to bottom. Fix the first
FAILfirst; a dead bus can make later parts fail too. - Trust the pin numbers in the fix line over the photo you wired from. They come from the code that's actually running.
- Paste the lines back into the chat. Soldr replies often end by asking for exactly that, for example: "Tell me what the serial monitor shows if any LED misses its boot pulse."
If the Serial Monitor shows a crash dump or random characters instead of these lines, that's a different problem (often baud rate or a boot loop). Here's how to read that kind of output.
Why this matters for AI-written code
Code you didn't write yourself is harder to debug, because you don't know what it assumed. A self-test makes those assumptions visible: the addresses it expects, the pins it uses, which parts it can and can't detect. It's one of the checks we think AI-written firmware should always include, alongside the pin and power checks in is AI-generated Arduino code safe to flash?
Parts used in these examples, on Compoden: ESP32-DevKitC, MPU6050 module, TTP226 touch module.
Try it with your own build on app.soldr.ai. Sign in and get 100 credits free.